By Andrew Grant, Biomass Power Projects, LLC, Lee Enterprises Consulting
Canada, New England, and California all have Carbon Credit programs to achieve GHG reduction goals. Several forms of biomass diversion from landfills, farms, and other biomass – dependent GHG sources are already in operation to support significant GHG reductions. Examples of GHG reductions are given, and the carbon impact of the different commercially available biomass to GHG reduction processes are described.
The three groups of commercially guaranteed biomass conversion processes are:
1. Power Generation, Steam Generation, and CHP: from the combustion of biomass wastes. This industry, with about 100 independent units in operation in the US, is based upon pulp mill technology and includes fluid beds, pulverized fuels, and suspension grate technologies matched to well-proven emissions controls. High pressure steam is generated and drives turbines to make power.
While fluid beds can use fuels up to 65 % water, e.g. sludges, most units use waste woody biomass from a variety of sources, and provide an important regional waste disposal service in the Circular Economy. The GHG reduction is site specific – landfill diversion of biomass is strongly GHG Negative, while 100 % forestry waste fuel is approximately GHG neutral.
2. Anaerobic Digestion: AD is firmly established as the leading method of converting high moisture content organic wastes first to methane-rich gas, thence to power, pipeline gas, CNG / LNG. AD’s lower conversion efficiency and higher specific capital cost is offset by a consistent GHG reduction due to the sources of its biomass feedstocks, and in many cases by wider socioeconomic benefits in disposing of wastes.
3. Thermal Conversion to Hydrocarbons: This category includes simple pyrolysis, classical and advanced gasification processes, and direct catalytic conversion, with end products ranging from crude distillate oils, synthesis gas for all applications, and catalyst-tailored products. These processes generally have a high conversion efficiency, and their GHG reduction impact is largely a function of their biomass sources.
Power Generation, Steam Generation, and CHP
Over 100 US biomass Independent Power Producers, and our many biomass industrial and municipal Combined Heat and Power generators, do not grow and burn trees – they cannot afford to do so at current power prices. They all use some form of waste biomass fuel, often diverting the wastes from landfills. They cannot afford to plant and harvest either trees or other ‘energy crops’, even though such plantations have been tried.
The range of waste biomass fuels is wide – forestry wastes, including sawmill wastes, wastes from wood products manufacturing, non-recyclable waste paper, recycled paper mill wastes and sludges. In addition, biomass plants use wood waste diverted from municipal landfills to avoid methane generation, clean wood from construction and demolition sites, utility transmission line right-of-way clearance and urban tree removals – a huge volume. Finally, there is process waste from biodiesel and cellulosic fuels and chemicals production, agricultural wastes, straw and husks from grain crops and grain processing.
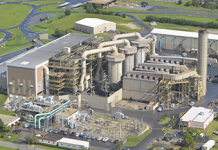
Some biomass plants, such as municipal Waste-to-Energy plants, combine recycling with power generation. The US has about 80 WtE biomass power plants, operating in compliance with emissions regulations. These third generation WtE plants, like those in Europe and the newer WtE plants being built in China, exhibit high reliability and extremely low emissions as the result of several decades of continuous process improvement.
The carbon footprint of biomass power plants is generally neutral as determined by UE EPA and US Department of Energy. Each location should calculate its own particular carbon footprint. Some biomass power is strongly carbon-negative, owing to the reduction in landfill methane emissions when biomass is diverted, even with landfill gas recovery, as shown below. Additional reductions in carbon footprint can be achieved by the use of biodiesel and renewable LNG or CNG in trucks and equipment – a growing trend.
Carbon Negative – a Simplified Calculation.
Dry wood consists of a mixture of cellulose, hemi-cellulose, and lignin. The ash-free chemical composition of wood can be represented either as C6H(H2O)6, or more simply as CH2O. CH2O is used below for the approximate calculation of the amount of methane, CH4, and carbon dioxide, CO2, that is released from a landfill when woody material undergoes anaerobic decomposition. Anaerobic decomposition is the result of the exclusion of air, the presence of water, and the presence of anaerobic and methane-forming bacteria, similar to the conditions in a swamp where methane, or marsh gas, is generated.
2 CH2O (water, bacteria), 2 x 30 = CH4 ,16, + CO2 , 44
One ton of dry, ash-free, wood in a landfill produces:
0.27 ton CH4
Plus 0.73 ton CO2
The typical 25 MW biomass power plants use from 1.05 to 1.1 dry ton of wood per net MW-hour; using 1.05 tons/ MWhr:
One MWhr of biomass power from diverted biomass avoids the formation of 0.28 tons of methane in a landfill.
As a GHG gas, methane is approximately 21 times as powerful as CO2. So one MWhr of diverted biomass power avoids the release of approximately 6 tons of CO2 equivalent, plus the CO2 also generated for a total of 6.7 tons of CO2 E per biomass MWhr.
However, most landfills practice landfill gas recovery. The EPA model uses a default value of 50 % LFG recovery when calculating emissions, but it is assumed that in southern California – the origin of LFG recovery technology – LFG recovery is approximately 65 %, as advised by SCS Engineers and industry sources. Therefore the net emissions of methane to the atmosphere are approximately:
0.28 tons CH4 / MWhr x 35 % net emitted = 0.1 ton of methane emission avoided per Biomass MWhr, or 2.1 tons of CO2 equivalent.
Wood waste deposited in a C&D landfill will generate LFG more slowly than in an MSW landfill, but typically there will be no LFG recovery at a C&D landfill. Once water accumulates, and oxygen is depleted, anaerobic decomposition will take place, yielding 6 – 7 tons CO2E per biomass MWhr.
Waste paper is lignin-free wood, and decomposes in the same way, but more rapidly than woody material.
If a given facility uses 50 % landfill-diverted biomass, and 50 % carbon-neutral forestry waste, then a pro rata calculation of the negative carbon impact can be used to calculate the Carbon Credits so created.
A typical 25 MW biomass power plant, using 100 % landfill diverted biomass, prevents the emission of about 1.2 MM tons per year of CO2 equivalent.
A typical 60 MW, 2,000 ton MSW/day waste to energy plant, where 100 % of the biomass fraction of the fuel avoids landfill decomposition, prevents the emission of about 2.9 MM tons/yr of CO2 equivalent.
Anaerobic Digestion
Most AD feedstocks would be converted to methane and CO2 if not so processed, therefore the above simplified calculation may be applied, with adjustment for the individual MAF organic analysis. Loss of carbon to digestate affects the overall carbon conversion efficiency of the particular AD process, but does not affect the negative carbon impact due to conversion. Negative carbon impact must be calculated on the MAF content of the feedstock, then converted to wet tons, or to gallons.
The additional socio-economic impact of many AD projects which eliminate the discharge of livestock manures and their consequent dam
age to rivers, lakes, fisheries and tourist business should be added to their negative carbon impact.
Although the carbon conversion efficiency of most AD processes is significantly lower than that in a combustion boiler, the heat rate of the gas engine gensets used for AD is better than that of a biomass boiler/steam turbine, such that an AD plant has negative carbon impact of about 5 tons of CO2 E per MWhr, compared to the 6.7 tons CO2 E for the solid biomass system. Care must be taken to define the alternative decomposition pathway of each part of the AD feedstock in calculating this value.
A typical 5 MW AD facility, using 100 % feedstock that would otherwise generate methane emissions, prevents the emission of about 200,000 tons per year of CO2 equivalent.
Thermal Conversion to Hydrocarbons
There are about a dozen commercially guaranteeable biomass conversion systems available. Some are equipped to handle MSW, others are limited to less-corrosive forestry wood wastes. In all cases, the negative carbon impact can be calculated from the feedstock analysis and the alternative disposal of that feedstock in the absence of the project.
A good example is the Edmonton, Alberta, Enerkem project which converts 100,000 tons/yr of RDF from MSW into approx 440 bbl/day of hydrocarbon, using a classic oxygen blown gasification process followed by gas clean-up and methanol synthesis.
Gasification processes have excellent carbon conversion efficiencies; if the resulting syngas is used in combined cycle power generation, a very efficient overall system results. But the carbon impact is based upon the feedstock consumption, not the MW output, so a lower negative carbon impact per MWhr than for a conventional boiler/turbine is the result.
The Enerkem Alberta project has a negative carbon impact of about 550,000 tons/year of CO2 equivalent, based upon 100 % of its feedstock being diverted from landfill.
Andrew Grant has a B.A. and M.A. from Cambridge University and over 35 years’ experience as a manager of biomass conversion projects. He has been involved in providing guarantees of performance, environmental impact and cost studies, for coal and biomass conversion technologies, and has performed due diligence studies of technologies and of facilities. Andrew is familiar with a wide range of biomass processing, ranging from wood chips to rice straw to MSW, and is experienced in greenhouse gas reduction and carbon footprinting, in the use of waste biomass, and other emerging technologies.
This article was originally published on Biofuels Digest. Biofuels Digest is the most widely read Biofuels daily read by 14,000+ organizations. Subscribe here.


