Tom Konrad CFA
In the third quarter, clean energy stocks in general continued their upward trend, turning in a 27% gain for the quarter and a 64% gain for the year as a whole, as measured by my benchmark and most broadly held clean energy ETF, Powershares Wilderhill Clean Energy (PBW.) This brings PBW back up to levels last seen in September 2011.
The broad market and my model portfolio of Ten Clean Energy Stocks for 2013 have also done well. My small cap benchmark (IWM) is up 10% for the quarter and 31% for the year, while my model portfolio is up 10% for the quarter and 21% for the year. I am disappointed, however, that my model portfolio now looks virtually certain to under-perform its sector benchmark for the first time since I started writing about in 2007, and the odds don’t look good for beating the broad market, either.
Sectors
While some of my under-performance can be attributed to my long-term avoidance of the solar sector and stocks which are household names (which has served me quite well over the last several years,) the poor performance of renewable energy developers and internationally listed companies (mostly in Canada) have also been a significant drag on the model portfolio.
Along with my model portfolio, I also included a list of six alternative picks of clean energy companies I liked, but which I did not include in the main list because I felt they were not as well valued as the others. I intended that readers who were uncomfortable with any of my top ten picks to substitute from this alternative list, instead. For instance, some of my picks are rather illiquid, and so larger investors would be unable to buy them without moving the share price too much. Similarly, readers who were not unwilling or unable to buy stocks which only trade internationally could put together a portfolio of nine US-listed stocks.

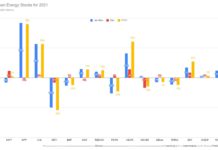
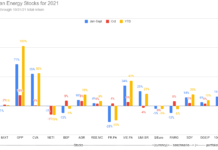
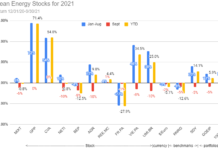
The chart above shows what the effects of such substitutions would have been, and also shows the performance of the clean energy sub-sectors (Efficiency, Efficient and Alternative Transportation, and Renewable Energy Developers) that account for at least four stocks among the sixteen.
As you can see, readers who decided to only use the highly liquid stocks from the two portfolios (the “Liquid” portfolio) or the US-Listed stocks (the “Domestic” portfolio) did somewhat better than those who decided to use my ten top picks. This is typical of the early stages of investor interest in a sector: The easy to buy and research stocks advance first and investors become familiar with a new (to them) sector. If investors’ renewed interest in clean energy stocks persists, we can expect its effects to spread to less liquid, lesser known, and more esoteric parts of the sector.
You can’t get much more esoteric than my collection of small and micro-cap Canadian renewable energy developers with listings on the Toronto Stock Exchange (TSX): Finavera Wind Energy (TSX-V:FVR, OTC:FNVRF), Alterra Power (TSX:AXY, OTC:MGMXF), US Geothermal (NYSE:HTM, TSX:GTH), and Ram Power Group (TSX:RPG, OTC RAMPF). This group declined an average of 22% for the year (including the effects of the declining Canadian dollar.) All have operations outside Canada, but only one (US Geothermal) also has has a US listing, and has significantly outperformed the other three. The three TSX-listed developers were down an average of 34% for the year, although they were up 1% in the 3rd quarter, while US Geothermal is up 16% year-to-date, despite having been, in my opinion, less undervalued in January.
I think the enthusiasm for US-listed clean energy stocks is largely driven by the resurgence of solar and other “story” stocks such as Tesla Motors (NASD:TSLA.) Investor enthusiasm for the Tesla story may also deserve credit for some of the strong performance (30% for the quarter, 53% for the year) of the transportation-related stocks in my portfolio (which does not include Tesla.)

Developing a Bottom
I included the four developers in the lists because, at the start of the year, I felt they were all trading at significant discounts to what their assets would fetch on the open market. Most stark of these was Finavera, which had recently reached a deal to sell most of its wind farm developments to Pattern Energy Group (NASD:PEGI). Unfortunately, two of the four wind developments Finavera was planning on selling turned out to be nearly impossible to permit, and then and a few delays shrunk my C$0.80 valuation at the time to just C$0.22, about what the stock was selling for in January. At C$0.13 it’s still a good value, but we’re unlikely to make a profit on this one.
The news at the other three developers, US Geothermal, Ram Power, and Alterra Power, in contrast, has been better, yet only US Geothermal has advanced. All three have been producing power and positive cash flow, yet can’t seem to catch investors’ attention. Yet given the current valuations, they don’t need investor attention to produce handsome returns from current prices. Including Pattern, there are a number of publicly traded renewable energy power producers would could buy US Geothermal or Ram Power outright and increase their cash flow per share. Given the exercise of Pattern’s over-allotment option, the company has over $60 million it can use to purchase renewable energy companies projects.
At Pattern’s current price of $23.29, it is trading at a forward dividend yield of 5.4%, at the low end of the 5% to 8% range of the five Canadian Power Producers discussed here. If US Geothermal’s distributable income were valued on the same basis, it would be worth $0.66 per share for an 8% distributable income yield, based on management’s projections for 2013 EBITDA and my interest estimates. Ram is in the process of remediating some of the wells at its San Jacinto-Tizate project, and this seems to be progressing well. When this is complete, the projects should be able to resume distributions to Ram. Hedge fund manager Keubiko valued Ram at $1 per share based on this one project in July.
Alterra is currently generating C$55 to C$60 million in annual EBITDA, and has debt service obligations of C$36 million for the next three years (after which they decline.) That leaves C$20 million of distributable income, or over 4 cents a share, which would lead to a value per share of C$0.54 at 8%, or C$0.86 at 5%, valuations which assign no value to the company’s development projects and rapidly declining debt service in 2017 and beyond. Given the conservative nature of this valuation, I think C$0.86 is closest to Alterrra’s true value, despite the fact that the stock is currently trading at C$0.30. Alterra
would not need to be bought out to achieve this valuation, all it would need to do would be to start paying a dividend, and get a US stock market listing (as Brookfield Renewable Energy Partners (NYSE:BEP)) recently did.
All three might reach higher valuations than I outlined above by continuing their strategies of developing projects and improving cash flows, but that would likely be a much longer term proposition.
Conclusion
With these developer stocks having stopped declining, and conservative valuations of their assets worth two to six times their current stock prices, I’ve been adding to my positions in Ram Power and Alterra. Potential buyers are multiplying as renewable energy power producers get access to cheap capital on the US markets, meaning more money will be chasing a limited pool of assets. These under-priced TSX-listed developers should become increasingly attractive acquisition targets for the likes of Patten and Brookfield, which memorably bought Western Wind Energy earlier this year.
While such buyouts take time, an offer or two later this year could do a lot to bring my model portfolio’s performance up closer to its benchmarks.
I plan to follow up with a discussion of recent news events affecting the rest of the stocks in my model portfolio soon.
Disclosure: Long FVR, AXY, HTM, RPG, BEP. Short TSLA calls.
DISCLAIMER: Past performance is not a guarantee or a reliable indicator of future results. This article contains the current opinions of the author and such opinions are subject to change without notice. This article has been distributed for informational purposes only. Forecasts, estimates, and certain information contained herein should not be considered as investment advice or a recommendation of any particular security, strategy or investment product. Information contained herein has been obtained from sources believed to be reliable, but not guaranteed.


