by Tom Konrad
David Kline, and his team at the National Renewable Energy Lab, wants to help China exceed its target of 30 GW of installed capacity by 2020 by miles. How is he helping? By developing a methodology to help the central planners find the "Geospatial Supply Curves"[.pdf] for wind within China’s regions. By a geospatial supply curve, he means the available sites for wind farms at each levelized cost of energy (LCOE,) associated with the geographical data as to where that capacity would be installed.
The team’s technique combines geographical wind speed data with turbine performance data, any excluded zones, and potential turbine densities. Steeper terrain forces down turbine densities. This is unfortunate because the best winds are usually found on ridges and mountainous regions. The resulting supply curves will allow a central planner to see where wind farms will need to be built (and at what cost) in order to reach any target capacity for the region studied. This will aid in the planning of roads, transmission, and other planning necessary in order to get the farms built.
Zhangbei Province Wind Supply Curve
Dr. Kline’s NREL team demonstrated (with help from Chinese partners) their methodology by using it on a region of China’s Heibei province, Zhangbei. The picture below is one geographic representation of their results.
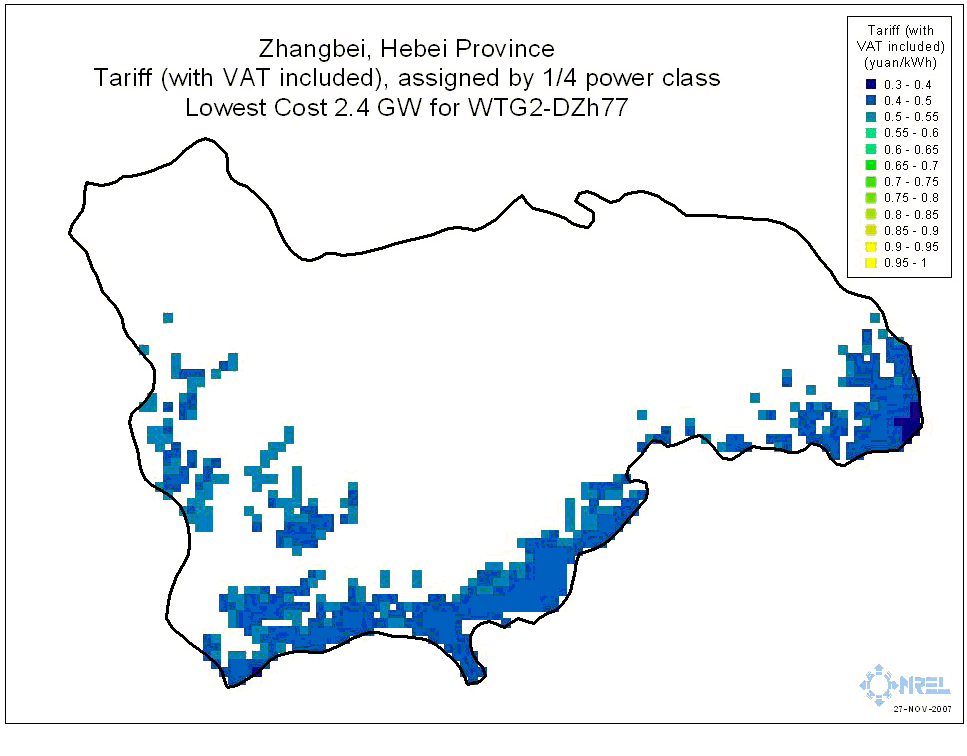 |
| Lowest cost 2.4 GW of wind farms in Zhangbei region of Heibei provence. Source: "A GIS Method of Developing Wind Supply Curves" David Kline, Donna Heimiller, and Shannon Cowlin, NREL. |
Most striking to me was not the analysis itself, or its results, but the many weaknesses of the analysis caused by limited budgets and lack of basic information. Dr. Kline cheerfully admits all these weaknesses, saying that he’d love to do the work in the detail it deserves… as soon as someone comes up with funding. All of the following came up during a recent presentation (pdf, 168 kb), or during the Q&A which followed.
- The team was unable to include transmission costs because they were unable to obtain Chinese transmission construction cost estimates.
- Only average wind speed data was used, resulting in the use of approximate wind speed profiles.
- No grid capacity or load data were available.
- The Chinese planners expressed a desire to include pumped storage an expanded model.
- No sensitivity analysis was done, either on uncertainties in wind regimes, construction costs, or other factors.
Model Limitations, but No Reason to be Smug
To me, the lack of fine transmission, load, and wind data are most troubling. There is a complex interplay between the timing of wind supplies in different locations with the load which I expect would have a great impact on the value of different potential wind farms… planning without this analysis would be like building a house without first knowing what sort of ground lies under the foundation.
China’s drive for more renewable energy is commendable, and the NREL team’s methodology will undoubtedly help in the placement of all those new wind farms, but even detailed wind and grid loading data are likely to remain unavailable even to the Chinese planners, which means that some wind power will not be able to get where it’s needed, and not all the most useful wind turbines will be built first; some efforts will be wasted. Nevertheless, the Chinese will likely forge ahead, which, in the end, is a lot better than analysis paralysis.
Before we Westerners chuckle at the lack of data (the Chinese grid does not even have a wholesale power market for price discovery) we should ask ourselves… how likely are we to reach 15% grid penetration of wind power by 2020? If you live in the U.S., as I do, the answer is "low to nil, and a lot less than China’s chance of getting there."


